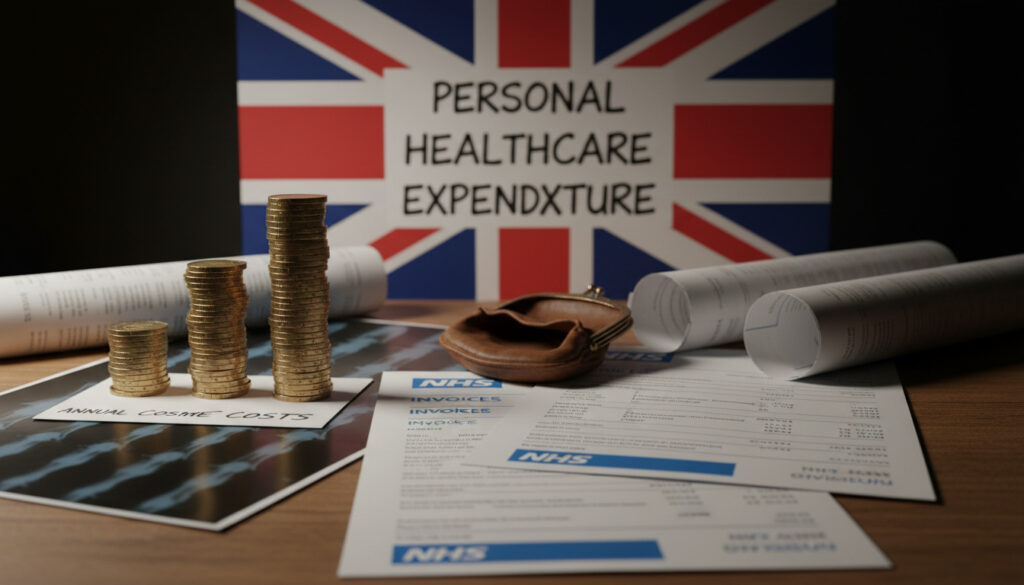
How Much Have I Cost the NHS – Annual Average and Lifetime Breakdown
The average person in the UK accounts for approximately £4,188 in annual NHS expenditure, according to Office for National Statistics data aggregated by insurance comparison platforms. While no official government calculator exists to tally individual lifetime contributions to the £153 billion health service budget, third-party tools attempt to translate tax-funded care into personal cost estimates.
Understanding these figures requires navigating a complex landscape of general taxation, National Insurance contributions, and point-of-care charges. Unlike private healthcare systems that issue itemised bills, the NHS operates on a pooled-risk model where costs remain largely invisible to the patient at the moment of treatment.
This examination breaks down verified per-capita spending data, analyses the tools available for personal estimation, and clarifies what remains uncertain about projecting lifetime healthcare costs against the backdrop of an aging population.
How can I estimate my lifetime cost to the NHS?
Several online calculators offer approximations of individual NHS expenditure, though none carry official NHS Digital certification. These tools aggregate costs from typical usage patterns including GP consultations, emergency department visits, and prescription volumes.
Annual Average
£4,188 per person based on 2022/23 ONS data and £153 billion total budget allocations.
Lifetime Estimates
Variable projections ranging £200,000+ depending on longevity and chronic condition status.
Primary Cost Drivers
Hospital inpatient stays, frequent GP appointments, A&E attendance, and prescription volumes.
Data Limitations
No official NHS lifetime calculator exists; third-party tools rely on aggregated statistical modelling.
Key insights on NHS cost estimation
- The NHS England budget reached £153 billion for the 2022/2023 financial year, serving approximately 1.3 million people daily.
- Taxation and National Insurance contributions fund 99% of services, with patient charges covering only 1% of operational costs.
- Online estimators such as those provided by GoCompare allow users to input personal medical history for tailored projections.
- Individuals with long-term conditions, disabilities, or frailty incur significantly higher annual costs than the £4,188 baseline average.
- My NHS Bill calculates hypothetical US-style insurance costs to illustrate the free-at-point-of-use value of British healthcare.
- Aging demographics continue to pressure per-capita averages upward, particularly regarding end-of-life care episodes.
- No comprehensive lifetime projections from NHS Digital, the King’s Fund, or the Institute for Fiscal Studies were available in current data sets.
Cost breakdown by service type
| Service Category | Estimated NHS Cost | Patient Charge | Notes |
|---|---|---|---|
| GP Consultation | £50–£100 | None | Standard 10-minute appointment |
| A&E Attendance | £300–£500 | None | Minor injury unit at lower end, major trauma higher |
| Hospital Stay (per day) | £400–£800 | None | Intensive care multiplies this significantly |
| Prescription Item | £9.65 | £9.65 (England) | Free for exempt groups including under-16s, over-60s, and certain conditions |
| Normal Childbirth | £1,500–£3,000 | None | Complicated deliveries including caesarean sections reach higher amounts |
| Ambulance Emergency Call-out | £250–£400 | None | Advanced life support teams at upper range |
What is the average annual cost per person to the NHS?
Quotezone’s analysis of Office for National Statistics figures establishes the £4,188 per-capita annual expenditure for 2022/23. This calculation divides the total NHS England budget by population figures, though actual individual costs vary dramatically by age and health status.
How does NHS funding composition affect these figures?
The £4,188 average derives primarily from general taxation and National Insurance contributions rather than direct patient payments. According to the same aggregated data, prescription charges, dental fees, and other point-of-service payments account for merely 1% of total NHS income.
British taxpayers do not receive itemised statements because the NHS operates as a risk-pooled system. The £4,188 represents your theoretical share of the collective burden, not a personal debt or usage-based invoice.
International comparisons and value demonstration
Tools such as My NHS Bill contextualise the £4,188 average by calculating what identical treatment episodes would cost under United States insurance-based models. These comparisons typically reveal that major procedures—often priced at tens of thousands in private markets—would generate lifetime bills exceeding $172,500 for individuals aged 65 and above in American systems, based on 2025 dollar valuations adjusted for 4% inflation.
What factors influence personal NHS costs?
While the £4,188 figure provides a statistical mean, individual lifetime costs diverge based on morbidity patterns, emergency service utilisation, and pharmaceutical requirements. Healthspan calculators indicate that patients managing frailty, disability, or end-of-life conditions generate substantially higher annual costs than healthy counterparts.
How do chronic conditions alter cost trajectories?
Population segments with long-term health conditions contribute disproportionately to the £153 billion budget. Demo calculators suggest that groups requiring intensive management generate yearly totals orders of magnitude above the baseline average, particularly when requiring frequent hospitalisation or specialised prescribing.
Multiple hospital admissions for complex conditions, extended intensive care stays, and repeated specialist consultations can elevate individual annual costs well into five figures. These cases, while statistically uncommon, significantly impact average calculations.
Which utilisation patterns drive variation?
Beyond chronic disease, acute incidents substantially affect individual totals. Emergency ambulance usage, unplanned A&E attendance, and inpatient episodes following trauma or acute illness accumulate costs rapidly. Conversely, preventive primary care engagement—though incurring regular GP visit costs—may reduce expensive hospitalisation frequency.
No official NHS Digital repository provides individual cost tracking. Patients cannot access centralised records of their specific contribution to the £153 billion expenditure, forcing reliance on estimation tools that aggregate typical costs rather than accessing personal medical accounting.
How does NHS funding translate to individual taxpayer burden?
The relationship between taxpayer contribution and personal consumption remains indirect. National Insurance deductions and general taxation flow into Treasury allocations for health, meaning the £4,188 annual share is prepaid through fiscal contributions rather than post-billed like herpes treatment pathways might be itemised in private dermatology.
What distinguishes NHS costs from social care expenses?
Critical distinctions exist between NHS medical costs and social care expenditure. While GP visits and hospital stays fall under the £4,188 NHS average, residential care and domiciliary support operate under separate means-tested local authority budgets. Legal & General’s care cost calculator addresses these non-NHS expenditures, which often require significant out-of-pocket contributions unlike the tax-funded health service.
How has per-capita NHS spending evolved?
-
NHS founded on principle of free care at point of delivery, establishing tax-funded model without per-patient billing mechanisms.
-
To understand the financial implications, you can explore what does insulin do and its associated costs. What does insulin do
Per-head spending rises significantly as new medical technologies, pharmaceutical advances, and wage costs expand budget requirements.
-
Austerity measures and efficiency drives attempt to control cost growth amid aging population pressures.
-
Budget reaches £153 billion, establishing the £4,188 per-person annual average validated by ONS analysis.
-
Econometric analyses link spending growth to mortality reductions and life-year valuations, though specific future per-capita projections remain unverified by requested institutional sources.
What remains certain versus uncertain about these estimates?
Established Data
- £4,188 annual average per person (ONS 2022/23)
- 99% tax-funded, 1% patient charges
- £153 billion total NHS England budget
- 1.3 million people served daily
- Hospital inpatient days cost £400–£800
Unverified Information
- Exact lifetime individual totals (no official calculator)
- NHS Digital, King’s Fund, or IFS future projections
- Specific cost variations without full medical record access
- Precise 2025/26 budget allocations and revised per-capita figures
Why do NHS cost estimates matter for UK taxpayers?
Transparent accounting of healthcare expenditure enables informed democratic participation regarding resource allocation. When taxpayers understand that their £4,188 annual share purchases comprehensive coverage—including emergency care, maternity services, and cancer treatment unavailable to uninsured populations—they grasp the fiscal efficiency of pooled risk models compared to pharmaceutical market valuations.
Furthermore, recognising the divergence between average and individual costs—particularly for those with disabilities or chronic conditions—shapes public discourse on health equity and sustainable funding. As demographics shift toward older age structures with intensive care requirements, understanding current expenditure baselines becomes essential for evaluating future policy proposals without recourse to speculative projection.
Where do NHS cost statistics originate?
Primary data derives from Office for National Statistics expenditure surveys and NHS England budget statements, aggregated by independent financial analysis platforms. NCBI econometric research provides longitudinal analysis linking spending to mortality outcomes, while tools like My NHS Bill publish detailed methodological explanations for their procedure-specific cost calculations.
“NHS spending per head has risen 3.5% annually”
Institute for Fiscal Studies (IFS)
Key takeaways on personal NHS costs
The verified £4,188 annual average provides a baseline for understanding individual contribution to Britain’s tax-funded healthcare system, though no official mechanism exists to calculate precise lifetime personal totals. Third-party estimators fill this gap using aggregated service costs, revealing significant variation based on age, chronic conditions, and emergency service usage. As the population ages and budget pressures mount, these figures serve as reference points for public discourse rather than individual billing instruments.
Frequently asked questions
Is there an official NHS lifetime cost calculator?
No. NHS Digital does not provide personal cost tracking tools. Third-party estimators use aggregated statistics to approximate individual totals based on reported usage patterns.
How much does a single A&E visit cost the NHS?
Between £300 and £500 per attendance depending on complexity, according to aggregated cost data. Minor injury units cost less; major trauma resuscitation costs significantly more.
Do prescription charges reflect the full NHS cost?
No. The £9.65 charge in England covers only a fraction of actual pharmaceutical costs. Many medications cost the NHS significantly more than the patient contribution.
Why doesn’t the NHS send me an itemised bill?
The service operates on pooled-risk principles funded through taxation. Itemisation would require tracking infrastructure that contradicts the free-at-point-of-use model established in 1948.
How much more do elderly patients cost annually?
Significantly more than the £4,188 average, particularly during end-of-life phases requiring intensive hospital care, though specific multipliers vary by individual morbidity and frailty levels.
Can I reduce my tax burden by using private healthcare?
No. NHS funding through National Insurance and general taxation continues regardless of private healthcare usage. These are mandatory contributions, not opt-in premiums.
More related posts
 Urban Outfitters Near Me – Find Stores, Hours & Locations
 When Does Menopause Start? Age, Symptoms, and Stages
 The Picture of Dorian Gray: Plot, Themes & Controversy
 Lee Kang-in: Rating, Stats, Market Value & PSG Info
 Capital of Northern Ireland: Belfast Facts, History & UK Role
 M&S Bank Current Status: What Happened, HSBC Ownership & Access
 Michael van Gerwen Wife: Inside the Split with Daphne Govers
 Back to Black Movie Guide: Cast, Reviews, Where to Watch